Alcohol holds a complex place in American society, with its use spanning celebratory, casual, and concerning behaviors.
Although the legal drinking age is 21, the 2022 National Survey on Drug Use and Health (NSDUH) found that 21.7% of Americans aged 12 and older reported binge drinking in the previous month, illustrating the widespread nature of alcohol consumption.
This behavior takes a serious toll. Alcohol-related diseases and incidents claim nearly 178,000 lives annually, marking it as one of the nation’s leading preventable causes of death. On the economic front, the impact is equally harsh, with excessive drinking costing the U.S. economy an estimated $250 billion each year.
The statistics we analyze provide a comprehensive understanding of alcohol’s impact across America, revealing the breadth of its consequences, from consumption habits to related death rates and economic burdens.
This knowledge is vital for communities, health authorities, and policymakers as they strive to address the ramifications of alcohol misuse and extend support to those affected throughout the nation.
US states with the highest alcohol consumption
Across America, per capita ethanol consumption spans beer, wine, and spirits, with a national average of 2.51 gallons. According to the National Institute on Alcohol Abuse and Alcoholism (NIAAA), a “standard drink” in the United States contains 0.6 fluid ounces of ethanol, which is usually found in 12 ounces of regular beer or 5 ounces of wine.
We spotlight the top five states where residents’ alcohol consumption notably exceeds the national average and what their consumption translates to in “standard drinks.”
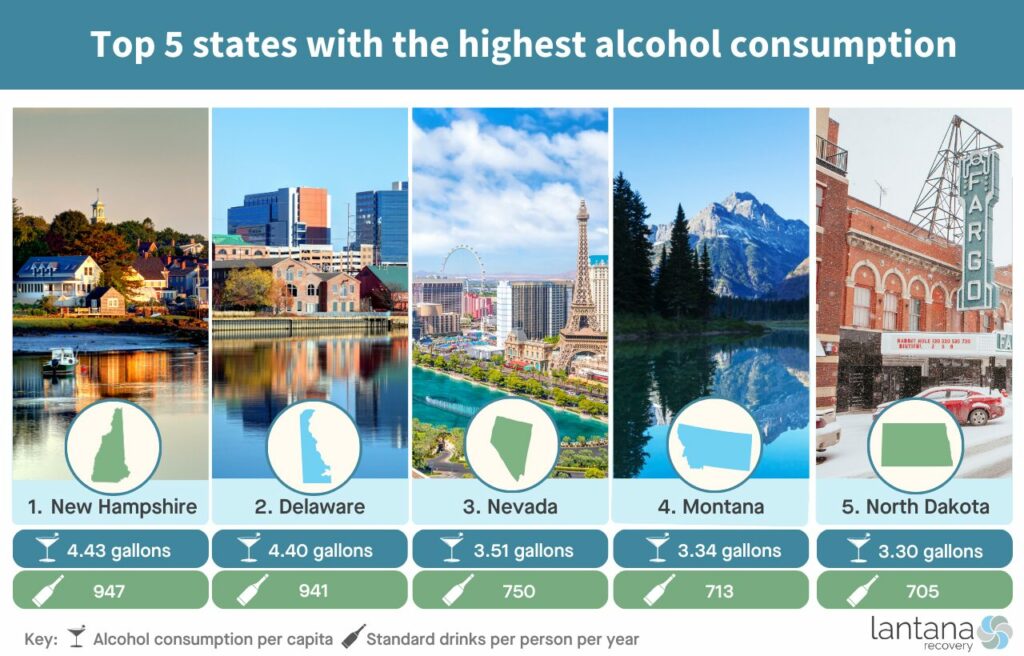
1. New Hampshire
Alcohol consumption per capita: 4.43 gallons
New Hampshire, situated in the Northeast, leads the nation in alcohol consumption, even as it reports a decrease from 4.80 the previous year to 4.43 gallons per capita. Remaining 76% above the national average, this level of intake translates to about 947 standard drinks per person annually.
2. Delaware
Alcohol consumption per capita: 4.40 gallons
Delaware ranked second in alcohol consumption per capita. The state’s consumption increased from 4.00 gallons the previous year to 4.40 gallons, 75% higher than the national average, translating to 941 standard drinks per individual each year.
3. Nevada
Alcohol consumption per capita: 3.51 gallons
Nevada, known for its bustling tourist cities, ranks third in alcohol consumption. The state saw a slight rise from 3.45 gallons the previous year to 3.51 gallons. That’s 40% above the U.S. average, with each Nevadan consuming around 750 standard drinks annually.
4. Montana
Alcohol consumption per capita: 3.34 gallons
Montan is in fourth place and has slightly increased its consumption from 3.31 gallons the previous year to 3.34 gallons. This represents 33% more than the national average, amounting to about 713 standard drinks per person yearly.
5. North Dakota
Alcohol consumption per capita: 3.30 gallons
Fifth-ranked North Dakota, expansive in territory yet sparsely populated, raised its per capita alcohol consumption from 3.20 gallons the previous year to 3.30 gallons. This is 31% above the national average or roughly 705 standard drinks per person per year.

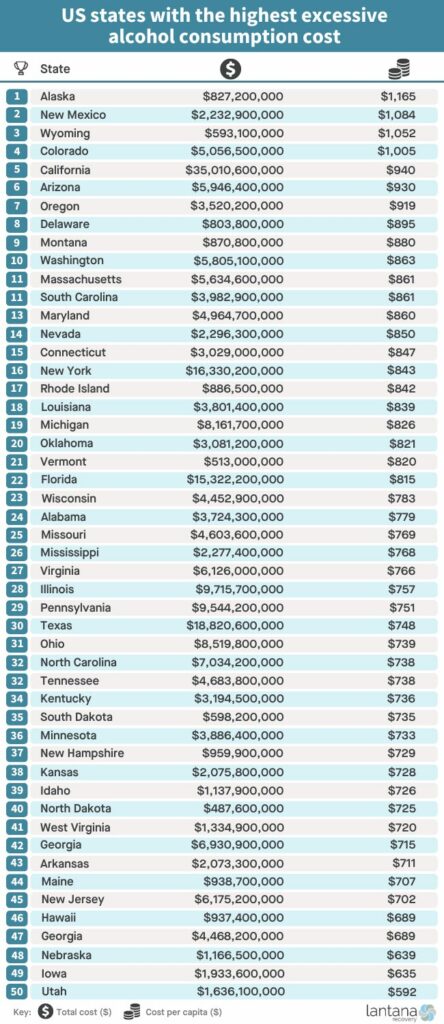
US states with the highest excessive alcohol consumption cost
The cost of excessive alcohol consumption in the U.S. encompasses more than personal health—it extends to losses in workplace productivity, healthcare expenses, law enforcement and criminal justice costs, property damage, and motor vehicle crash expenses.
With a national average economic impact of $807 per capita, we explore the top five states where the financial toll of excessive drinking significantly exceeds this cost, as tracked by the CDC.
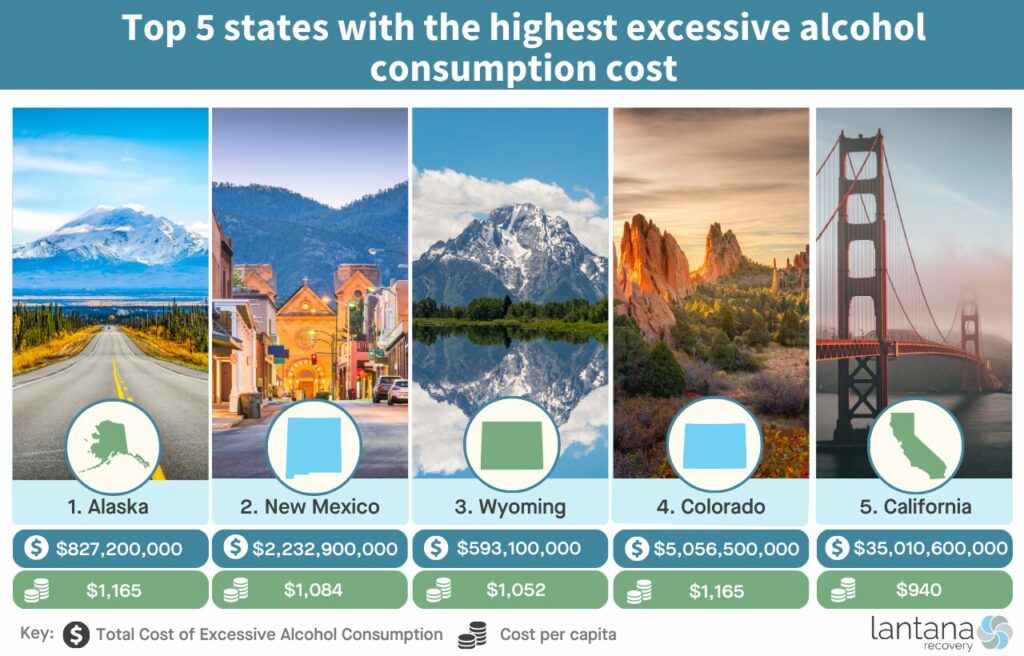
1. Alaska
Total Cost of Excessive Alcohol Consumption: $827,200,000
Cost per Capita: $1,165
Ranking first in economic costs from excessive alcohol consumption, Alaska, with vast wilderness and a relatively small population, sees the highest cost per capita at $1,165. That’s 44% higher than the national average and contributes to a state total of $827.2 million.
2. New Mexico
Total Cost of Excessive Alcohol Consumption: $2,232,900,000
Cost per Capita: $1,084
New Mexico, renowned for its rich cultural heritage and the fifth-largest state by area, ranks second in the cost of excessive drinking at $1,084 per capita. This is 34% above the national average, amounting to an aggregate cost of $2.23 billion.
3. Wyoming
Total Cost of Excessive Alcohol Consumption: $593,100,000
Cost per Capita: $1,052
Wyoming, known for its open ranges and being the least populous state, stands third with a per capita cost of $1,052, 30% over the national average, leading to a total state cost of $593.1 million due to excessive alcohol use.
4. Colorado
Total Cost of Excessive Alcohol Consumption: $5,056,500,000
Cost per Capita: $1,005
Colorado, nestled in the heart of the Rocky Mountains and ranked 21st in population, is fourth with a per capita cost from excessive alcohol consumption of $1,005. This figure is 24% higher than the national average, with a total cost of $5.06 billion for the state.
5. California
Total Cost of Excessive Alcohol Consumption: $35,010,600,000
Cost per Capita: $940
California, the most populous state with a diverse and expansive economy, places fifth in this ranking. Its per capita cost of $940 is 16% higher than the national average, resulting in an overall cost of $35.01 billion from excessive alcohol consumption.
US states with the most alcohol-related death rate
Alcohol-related fatalities underscore the grave impact of excessive drinking on public health in the United States.
According to the Centers for Disease Control and Prevention (CDC), the country sees an average of roughly 488 alcohol-related deaths daily, demonstrating the critical need for heightened awareness and intervention. While the average alcohol-related death rate across the nation is 14.4 per 100,000, some states report significantly higher rates, emphasizing the need for focused public health responses.
The states featured below have the most elevated alcohol-related death rates, each exceeding the national average. These rates are particularly concerning when compared to the respective state-level mortality figures, indicating the urgent need for tailored strategies to address this issue.
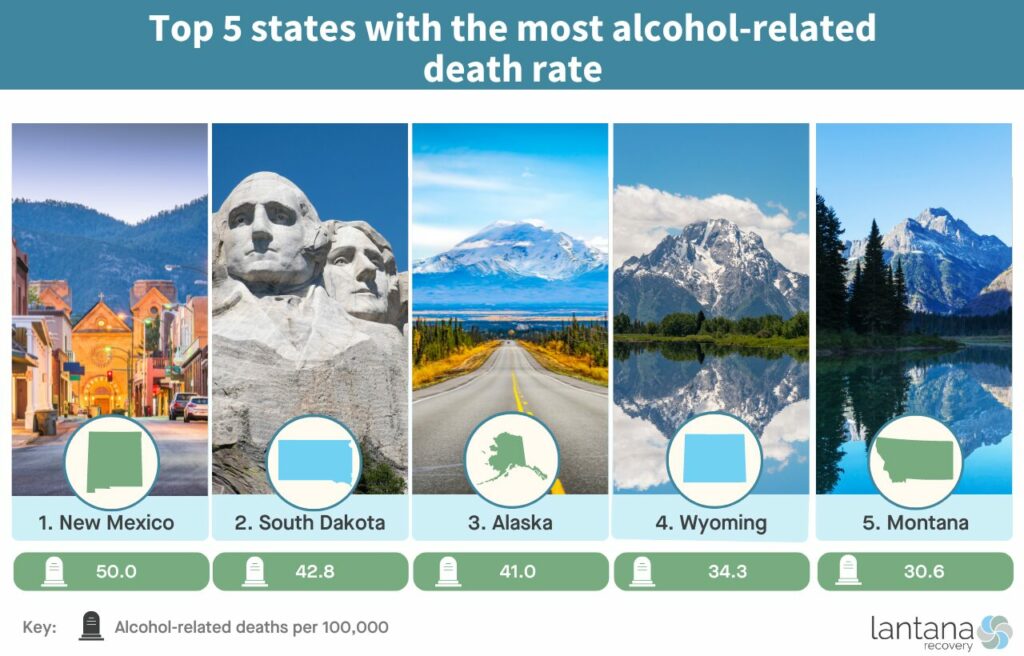
1. New Mexico
Death rate per 100,000 people: 50.0
New Mexico not only ranks second in the states with the highest excessive alcohol consumption cost but also leads US states with the highest alcohol-related death rate at 50.0 per 100,000. This rate is a staggering 247% higher than the national average for alcohol-related deaths, underscoring a pressing public health and economic issue, and accounts for 4.18% of the state’s overall death rate of 1,195.7 per 100,000.
2. South Dakota
Death rate per 100,000 people: 42.8
Located in the Midwestern region of the United States, South Dakota has the second-highest rate of alcohol-related deaths at 42.8 per 100,000. This rate is 197% higher than the national average for alcohol-related deaths and contributes to 4.18% of the state’s overall death rate of 1,025.8 per 100,000.
3. Alaska
Death rate per 100,000 people: 41.0
Alaska holds the third-highest alcohol-related death rate at 41.0 per 100,000 and is also first in the states with the highest excessive alcohol consumption cost. The alcohol-related death rate is about 185% higher than the national average and equates to 4.84% of Alaska’s total death rate of 847.3 per 100,000.
4. Wyoming
Death rate per 100,000 people: 34.3
Wyoming, ranking third in the states with the highest excessive alcohol consumption cost, also has the fourth-highest alcohol-related death rate in the nation at 34.3 per 100,000. This rate is 138% above the national average for alcohol-related deaths, indicating a severe impact on public health as it comprises 3.02% of Wyoming’s total death rate of 1,137.2 per 100,000.
5. Montana
Death rate per 100,000 people: 30.6
Montana, one of the top-ranking states with the highest alcohol consumption, confronts a significant alcohol-related death rate of 30.6 per 100,000. This rate is 113% higher than the national average for alcohol-related deaths and accounts for 2.66% of Montana’s overall death rate of 1,150.7 per 100,000.

US states with the most alcohol treatment facilities
Alcohol treatment facilities are vital to public health efforts against substance abuse. The average number of alcohol treatment facilities per 100,000 is 2.82 across states – this benchmark underscores the varying levels of resource availability. The following states lead in alcohol treatment facility access, highlighting their commitment to public health services.
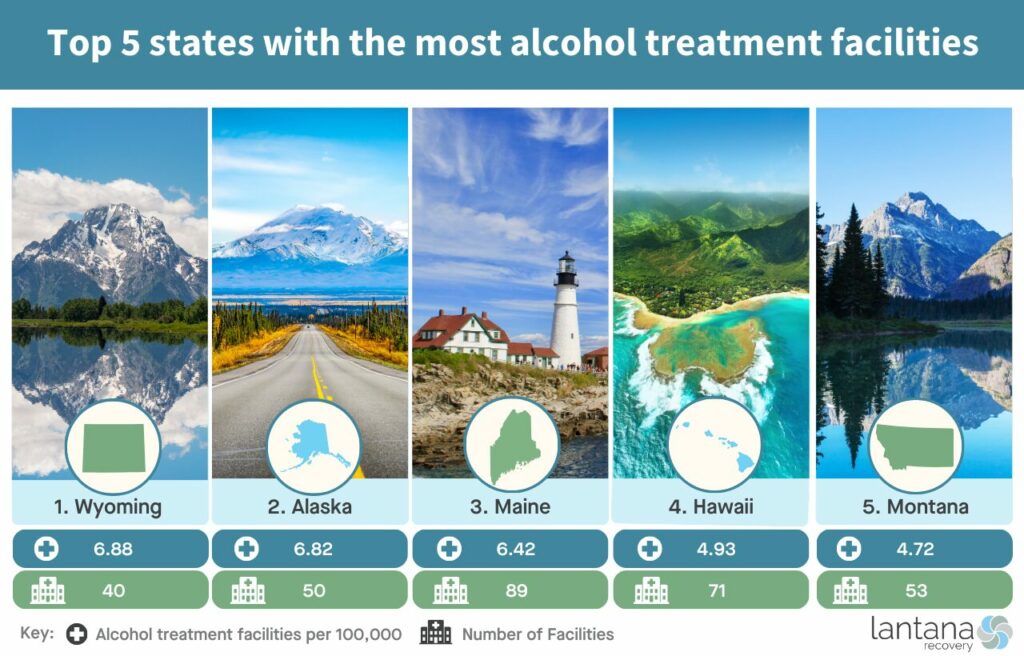
1. Wyoming
Alcohol treatment facilities per 100,000: 6.88
Wyoming ranks first in alcohol treatment facility availability with 6.88 per 100,000 people—145% above the average rate of 2.82. While leading in facility access, Wyoming grapples with substance abuse, evidenced by its alcohol-related death rate of 34.3 per 100,000 and an economic cost of $1,052 per capita, totaling $593.1 million.
2. Alaska
Alcohol treatment facilities per 100,000: 6.82
Alaska, second in the nation, provides 6.82 facilities per 100,000 population, which is 142% above the average. The state’s substantial alcohol-related death rate of 41.0 per 100,000 and the highest per capita cost from alcohol misuse at $1,165, resulting in a total economic cost of $827.2 million, underscores the critical need for accessible treatment.
3. Maine
Alcohol treatment facilities per 100,000: 6.42
Maine provides a substantial number of treatment options, offering 6.42 alcohol treatment facilities per 100,000 people—128% above the national average. As the state with the 14th highest alcohol-related death rate at 18.8 per 100,000 and an economic impact of $707 per capita, these facilities are a critical component of Maine’s public health response to alcohol misuse.
4. Hawaii
Alcohol treatment facilities per 100,000: 4.93
Hawaii ranks fourth, providing 4.93 facilities per 100,000, which is 75% above the average. The state’s lowest alcohol-related death rate among the top five, at 8.2 per 100,000, and an economic cost of $689 per capita, with a total impact of $937.4 million, demonstrate alignment of treatment facility access with the state’s alcohol-related health outcomes.
5. Montana
Alcohol treatment facilities per 100,000: 4.72
Ranked fifth, Montana provides 4.72 alcohol treatment facilities per 100,000 people—67% above the national average. With an alcohol-related death rate of 30.6 per 100,000, Montana’s need for these facilities is underscored. The state also bears an economic burden of $880 per capita due to excessive drinking, tallying to a total cost of $870.8 million.

US states with the highest alcohol treatment admission and discharge rates
Timely admissions and successful discharges from alcohol treatment programs are critical to mitigating the public health impact of substance abuse.
By examining treatment rates, measured per 100,000, alongside CDC data on adult binge drinking intensity, we gain insights into the interplay between behavioral health patterns and the utilization of treatment services in various states.
States with the highest alcohol treatment admission rate:
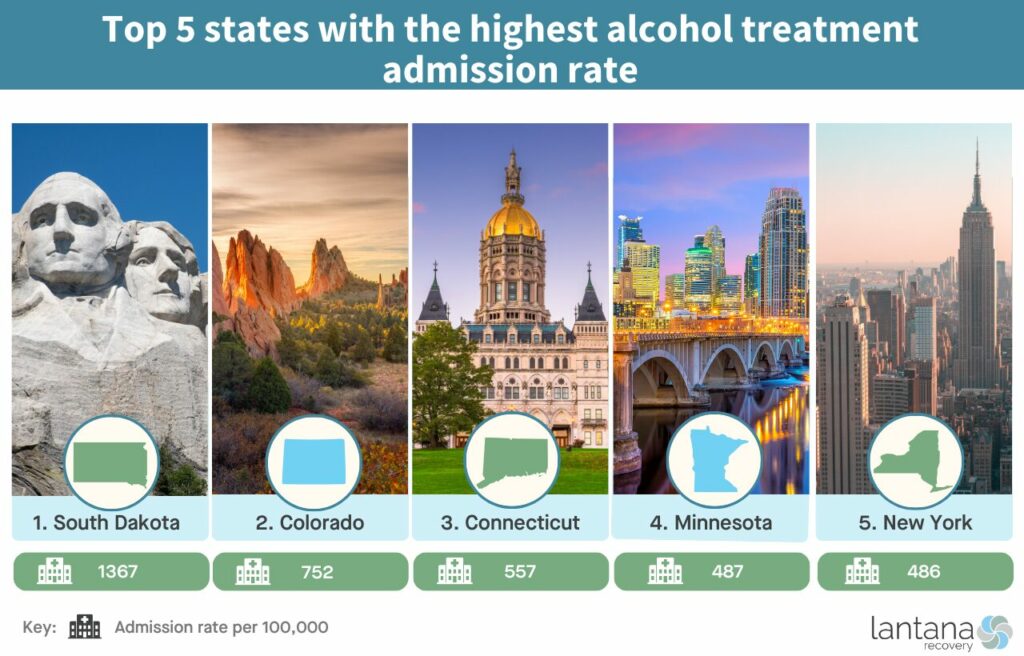
1. South Dakota
Alcohol treatment admission rate: 1367
South Dakota has the highest admission rate at 1,367 per 100,000 residents, suggesting a high level of accessibility to alcohol treatment services. The state ranks high in binge drinking intensity, with the top 25% of binge drinkers consuming at least 7.7 drinks per occasion.
2. Colorado
Alcohol treatment admission rate: 752
With an admission rate of 752 per 100,000, Colorado comes in second, indicative of its well-established treatment network. Binge drinking in Colorado is notable as well, with the heaviest 25% of drinkers consuming more than 7.4 drinks on average.
3. Connecticut
Alcohol treatment admission rate: 557
With an admission rate of 557 per 100,000, Connecticut is proactive in addressing alcohol treatment, apparent in its rank as the third-highest state for admissions. Binge drinking prevalence is also significant, with a substantial portion of drinkers exceeding 6.5 drinks on a single occasion.
4. Minnesota
Alcohol treatment admission rate: 487
Ranking fourth in admission rates, Minnesota actively facilitates access to alcohol treatment with a rate of 487 per 100,000. The state’s binge drinking data reveals that a sizeable number of drinkers report consuming over 7.7 drinks during their most intense sessions.
5. New York
Alcohol treatment admission rate: 486
New York, with an admission rate of 486 per 100,000, ranks fifth and demonstrates robust treatment service utilization across its populous and diverse regions. The state’s binge drinking data shows a considerable segment of drinkers consuming 6.8 drinks or more during their heaviest drinking occasions.

States with the highest alcohol treatment discharge rate:
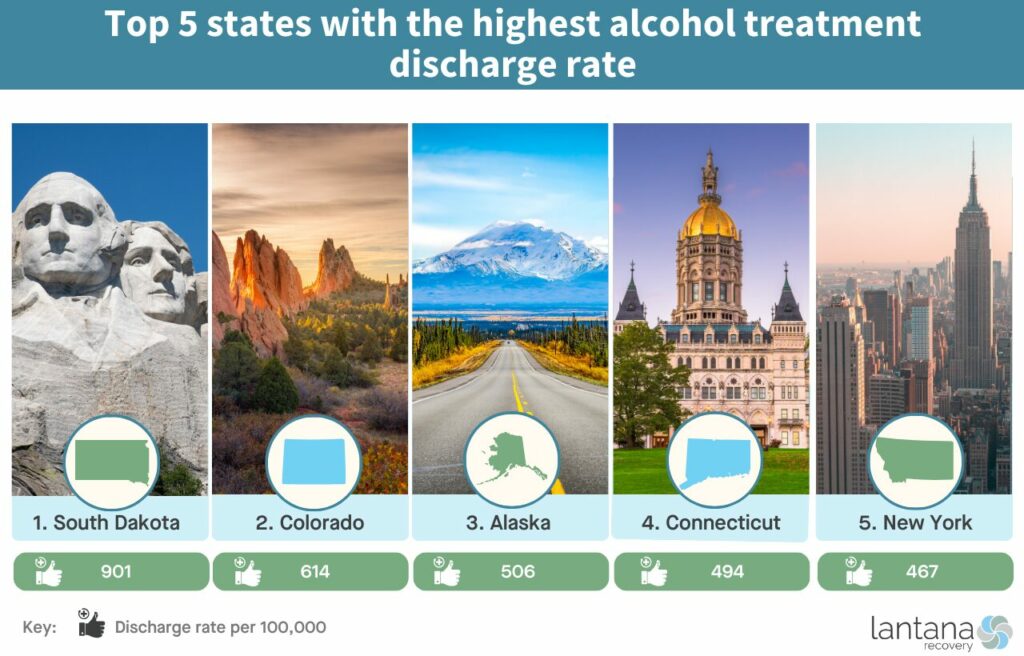
1. South Dakota
Alcohol treatment discharge rate: 901
South Dakota leads not just in alcohol treatment admissions but also in discharges, with a rate of 901 per 100,000 residents. This high discharge rate aligns with the state’s drinking patterns, where a significant number of individuals report higher binge drinking rates.
2. Colorado
Alcohol treatment discharge rate: 614
Maintaining its position in discharges with a rate of 614 per 100,000, Colorado continues to showcase the effectiveness of its treatment programs in a state known for considerable levels of binge drinking.
3. Alaska
Alcohol treatment discharge rate: 506
Alaska, having a discharge rate of 506 per 100,000, places third among the states. This rate indicates strong outcomes from its treatment services amidst the challenges presented by higher rates of alcohol consumption.
4. Connecticut
Alcohol treatment discharge rate: 494
Connecticut’s discharge rate of 494 per 100,000 signals strong treatment outcomes in a state where binge drinking is prevalent. These services are key to supporting individuals from initial treatment to recovery, addressing the significant public health impacts of alcohol misuse.
5. New York
Alcohol treatment discharge rate: 467
New York’s discharge rate of 467 per 100,000 reinforces the state’s comprehensive approach to alcohol treatment, supporting a population with diverse drinking behaviors, including those who drink heavily on occasion.

Dealing with Alcohol Abuse
Dealing with alcohol abuse requires a multifaceted approach that acknowledges the complexity of the disorder. Here’s how you can navigate this challenging journey:
1. Recognize the Signs
Begin by identifying behaviors indicative of alcohol misuse. Classic signs include drinking in secrecy, neglecting responsibilities at work or home, engaging in reckless behavior, and a noticeable shift in mood or personality when not drinking. Emotional turbulence, such as unexplained outbursts or increased irritability, may also be a signal.
2. Acknowledge the Problem
Accepting that alcohol has become a problem is a pivotal moment in the path to recovery. It’s necessary to confront denial head-on, as it often serves as the primary defense mechanism preventing individuals from seeking the help they need.
3. Seek Professional Help
Reach out to healthcare providers or explore treatment facilities that specialize in addiction. In South Carolina, organizations like the Addiction Professionals of South Carolina offer valuable resources and connections to professionals who can guide you through the recovery process.
4. Create a Supportive Environment
Construct a network of friends, family, and peers who understand the journey and can offer support. A supportive environment is a cornerstone of sustained recovery, fostering a space where honest communication is encouraged and emotional needs are met.
5. Explore Treatment Options
Investigate comprehensive treatment programs that incorporate various approaches personalized to individual needs. Options range from inpatient rehab and behavioral therapies to medication-assisted treatments and outpatient support groups such as Alcoholics Anonymous.
Recognizing Alcohol Abuse: Signs to Watch For
Identifying alcohol abuse requires careful observation of physical, emotional, and behavioral changes. While some signs may be overt, others are subtler and require a closer look, especially when determining if you or someone you love is experiencing issues with alcohol.
Health Complications
Alcohol abuse can wreak havoc on the body, leading to a spectrum of health issues. Initially, these may manifest as seemingly minor problems like sleep disturbances or frequent hangovers. However, over time, more serious health complications may arise. Chronic conditions associated with long-term alcohol abuse include:
- Liver Disease – Including fatty liver, hepatitis, and the more severe condition of cirrhosis, which occurs due to long-term liver damage.
- Cardiovascular Problems – High blood pressure, heart disease, and increased risk of stroke are linked to excessive drinking.
- Gastrointestinal Issues – Including ulcers, gastritis, and pancreatitis.
- Neurological Impairments – Altered brain function can lead to memory issues, impaired problem-solving abilities, and coordination problems.
Disruption to Daily Life
When alcohol use begins to interfere with day-to-day activities, it’s an indication that drinking has become more than a casual habit. This disruption can take multiple forms:
- Workplace Difficulties – Frequent tardiness, missed deadlines, and decreased productivity are often early signs of a problem.
- Educational Challenges – Struggling with school assignments, skipping classes, or dropping grades can signal abuse in students.
- Family Strain – Neglecting family commitments, parenting responsibilities, or causing family conflicts are potential warning signs.
- Social Withdrawal – Losing interest in social activities once enjoyed or avoiding social interactions unless alcohol is involved can be indicative of a developing issue.
Behavioral Indicators
Behavioral changes are often the most noticeable signs of alcohol abuse. Some of these may include:
- Secretive Behavior – Hiding alcohol, lying about consumption, or drinking in isolation can suggest a dependence on alcohol.
- Rationalizing Drinking – Making excuses to drink, such as to relax, deal with stress, or feel normal, indicates problematic behavior.
- Reckless Decisions – Engaging in risky activities while drinking, such as driving under the influence or participating in unsafe behaviors.
- Neglected Appearance – A lack of interest in personal grooming or appearance could also be a sign.
Emotional Symptoms
Alcohol abuse can lead to emotional volatility, including depression, anxiety, and other mood disorders.
The American Psychiatric Association’s DSM-5 outlines specific criteria for diagnosing Alcohol Use Disorder (AUD), which include an increased tolerance for alcohol, withdrawal symptoms upon cessation, and a pattern of excessive or compulsive use.
If you’re seeing these symptoms, it’s crucial to seek help. In South Carolina, you can turn to the SC Department of Alcohol and Other Drug Abuse Services (DAODAS), which offers resources for finding local treatment services and support.
Recognizing and admitting to a problem with alcohol is a significant step. Timely intervention, backed by a compassionate support system and professional guidance, is essential for successful recovery.
Remember, taking the first step towards seeking help is a sign of strength, not weakness, and it paves the way for a healthier future.
Methodology
Our research, “Alcohol Across America,” derives its insights from a collection of the latest authoritative data sources, carefully pieced together to paint a comprehensive picture of alcohol consumption and its repercussions in the U.S.
For alcohol consumption rates per capita, our primary source was the latest Surveillance Report #120 from the National Institute on Alcohol Abuse and Alcoholism (NIAAA), which provided recent figures on gallons of ethanol consumed per capita in each state.
To assess the economic burden of excessive drinking, we turned to data from the Centers for Disease Control and Prevention (CDC). This allowed us to rank each state based on the cost of excessive alcohol consumption per capita, offering a clear view of the financial toll.
The sobering statistics on alcohol-related deaths were sourced from the Kaiser Family Foundation, which obtained its data from the CDC WONDER database, presenting death rates per 100,000 population for direct state-by-state comparison.
To evaluate the availability of alcohol treatment facilities, we utilized the most recent National Survey of Substance Abuse Treatment Services (N-SSATS): 2020 report provided by the Substance Abuse and Mental Health Services Administration (SAMHSA).
Lastly, for insights into alcohol treatment admissions and discharges, we consulted the latest Treatment Episode Data Set (TEDS) 2021, also from SAMHSA, which informed our understanding of the treatment landscape and recovery outcomes in each state.


